Projections
Select Scenario:
Check Date:
Projection
Rerpots
Hospitalized
ICU
Deceased
Effective Reproduction Number
Additional data on charts
- Daily reported according to data provided by the MSPyBS.
Scenarios with historical rates of contagion in Paraguay
- Scenario for the plateau (Replay number equal to unity).
- Scenario using the representative low contagion rate history in Paraguay.
- Scenario using the historical representative high contagion rate in Paraguay.
Scenarios assumed in case of maintaining current measures
- Scenario using the average transmissibility of the last month.
- Projection using the last value of the transmissibility.
- Scenario assuming that the measures are relaxed by 10% with respect to the last month.
- Scenario assuming that the measures are tightened by 20% with respect to the last month.
Daily Estimated Infections
- This curve shows the daily estimated infections after correcting for bias due to the testing rate.
Projection of possible new Infected/Daily reported
Projection of daily hospitalized patients with unlimited bed capacity
Projection of daily ICU hospitalized patients with unlimited bed capacity
Daily death projection
Effective Reproduction Number
The effective reproduction number, R, represents the number of new cases that is generated from a positive case, according to cases reported by the Ministry of Public Health and Social Welfare of Paraguay.
When R = 1, each positive case infects only one more person and in this case the epidemic remains stable, observing a plateau in the number of cases.
When R is greater than 1, each positive case infects more than one person and in this case the epidemic is expanding and increases positive cases.
When R is less than 1, each positive case infects (on average) less than one person, and in this case the epidemic is in contraction and decreases positive cases.
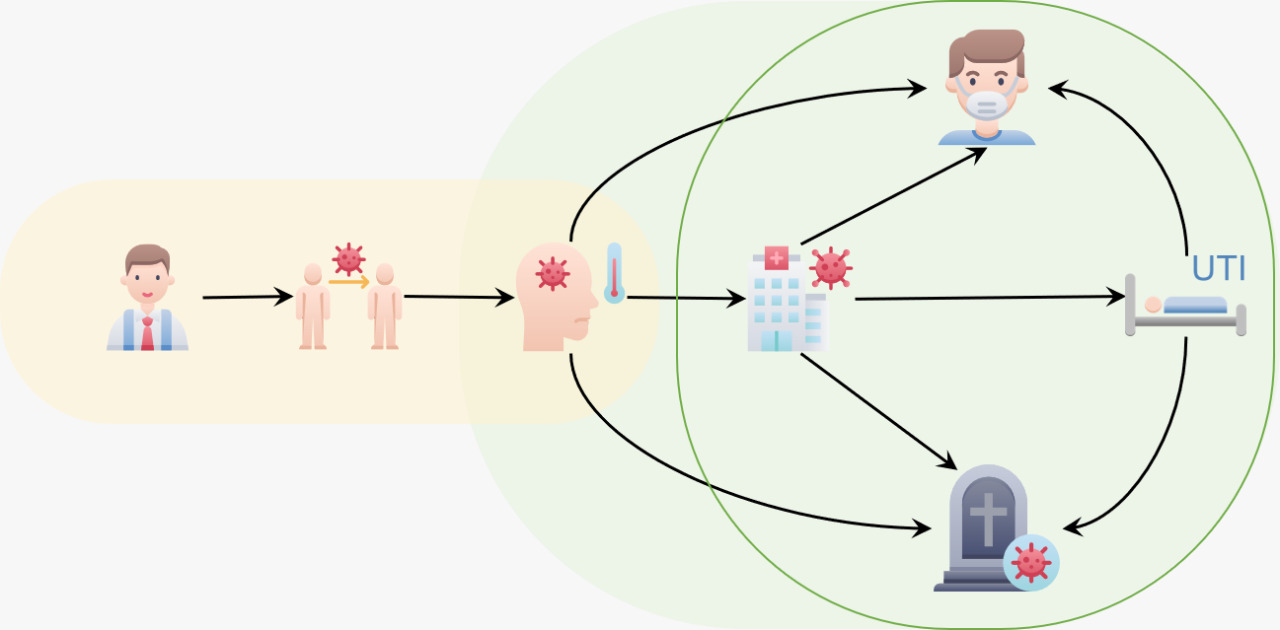
Proportions
The graph shows the evolution of the proportions of positive cases that pass to be hospitalized, intensive care unit and deceased cases:
- Proportion of hospitalized cases that are transferred to intensive care.
- Proportion of infected cases that are hospitalized.
- Proportion of cases in intensive care who die.
- Proportion of hospitalized cases that die (without going through intensive care).
- Proportion of infected cases that die (without being hospitalized).
The light colored area represents the uncertainty with a 95% credible interval.
Model
The model used for the simulations is a compartment-based model. Details can be found at the following link.
More detailsTeam


Carlos, Gaona
Research assistant
Carlos, Sauer
Research associate
Miguel, García
Research associate
Sandra, Irala
Research associate
Esther, Pedrozo
Research associate
Leticia, Segovia
Research associate
Eduardo, De los Santos
Research associate